
The debug mode in WordPress is a troubleshooting feature that helps identify and fix errors on a WordPress site. When enabled, it displays PHP errors, warnings, and notices that occur during code execution.
You can enable debugging for WordPress in several ways:
- from the Simplenet control panel
- from cPanel (for hosting solutions that use cPanel)
- manually by adding lines of code to the wp-config.php file
Let’s go through each method in detail.
How to Enable Debug Mode in WordPress from the Simplenet Control Panel
If you use Simplenet’s managed WordPress hosting, enabling debug mode is simple.
Login
Log in to your Simplenet control panel by accessing manage.simplenet.io and entering the username and password received by email. Alternatively, you can use SSO authentication from the client area: access my.simplenet.io, select your service, and click Login to Panel.
Enable debugging
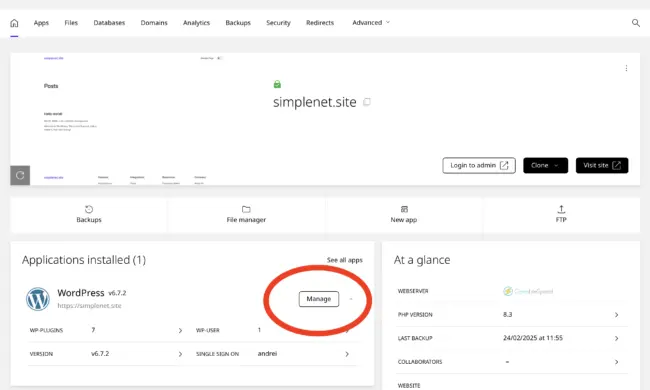
In the control panel, click on your website. Under Applications Installed, click Manage.
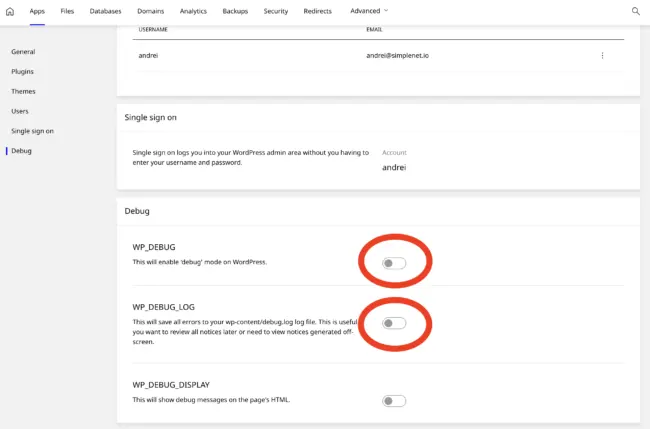
On the next page, scroll down to the Debug section or click the Debug link in the left-hand menu for quick access.
Activate the desired options by clicking the toggles:
- WP_DEBUG – enabled debug mode in WordPress
- WP_DEBUG_LOG – saves errors in the wp-content/debug.log file, useful for analysing problems later
- WP_DEBUG_DISPLAY (optional) – displays error messages on the frontend pages
After you activate it, please check the log file (wp-content/debug.log) for errors. When you’re done debugging, remember to turn off debug mode.
How to Enable Debug Mode in cPanel?
If you’re using a cPanel web hosting solution, you can enable debug mode from the WordPress Management section (formerly WP Toolkit).
Log in to cPanel
Go to yourdomain.com/cpanel and enter the login details (username and password) you received via email. Alternatively, use SSO authentication from the client dashboard, select your service and click on the Login to cPanel link in the left sidebar menu.
Enable Debug Mode
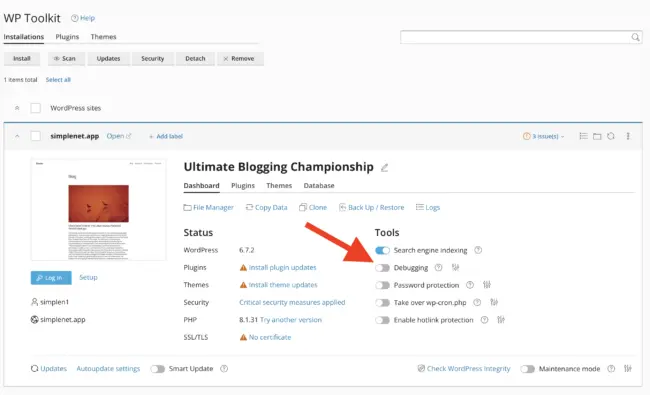
- In cPanel, go to WordPress Management
- Select your site
- In the Tools section, enable the Debugging option using the toggle
Advanced Settings
Click the Settings icon to configure additional options.
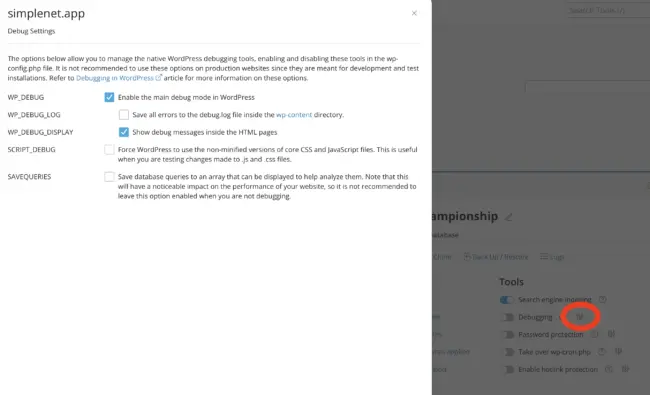
- WP_DEBUG – enable debug mode
- WP_DEBUG_LOG – save errors to wp-content/debug.log
- WP_DEBUG_DISPLAY – display debug messages in HTML
- SCRIPT_DEBUG – use development versions of JS and CSS files
- SAVEQUERIES – monitor MySQL queries for debugging
Once you have identified and resolved the issues, turn off debug mode to prevent the exposure of sensitive information and improve site performance.
How to Enable Debug Mode Manually by Editing the wp-config.php File
If your hosting provider does not offer a control panel with WordPress-specific features, you can enable debugging mode manually by editing the wp-config.php file.
To manually edit the wp-config.php file, the first step is to access it. You can do this in two ways:
- Using an FTP client like FileZilla, Transmit, or Cyberduck to connect to your server and navigate to your site’s root directory
- Using your hosting provider’s control panel, you can access File Manager or a similar feature to locate and edit the file directly from your browser
Once you have accessed the file, you can change the debugging settings as instructed below.
Delete the following line of code:
define( 'WP_DEBUG', false );Add the following lines of code before the line /* That’s all, stop editing! Happy blogging. */
define( 'WP_DEBUG', true );
define( 'WP_DEBUG_LOG', true );
define( 'WP_DEBUG_DISPLAY', false );
@ini_set( 'display_errors', 0 );
define( 'SCRIPT_DEBUG', true );
The above code generates a log with all errors, notifications, and warnings in a file called debug.log, which you can find in the wp-content folder.
Conclusion
Activating debug mode in WordPress is vital for identifying errors, but it’s essential to enable debug mode temporarily. Remember to turn off debug mode after resolving issues.
As always, if you need any help, do not hesitate to contact the Simplenet support team.
Leave a Reply