Google Analytics is the most used analytics tool by a huge margin. It provides a massive amount of data to get a better search ranking. It’s not the most user-friendly product ever created, but even less-experienced users can extract actionable data at first sight. You will enjoy using it once you get more experienced.
Google Analytics alone is irreplaceable, but it works best in partnership with Google Search Console. If you master these two tools, you will be a great SEO practitioner! Start mastering your Google Analytics skills by studying the following tips for intermediate to advanced users. Google Analytics may have secrets even from people who have used it for years.
Learn the Vocabulary
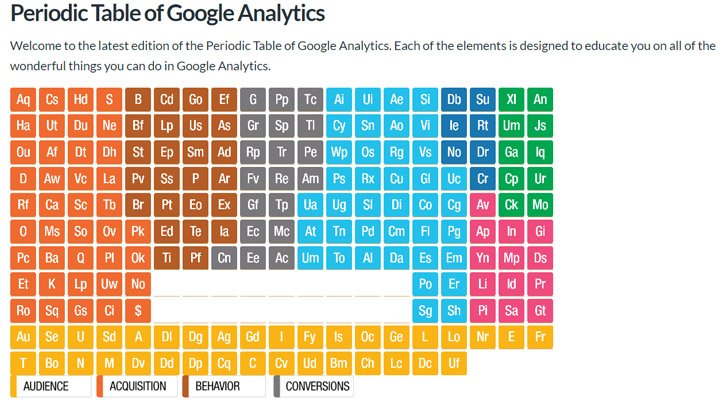
“Sessions,” “organic traffic,” “referrals,” “gender,” and “age” are intuitive terms used by most analytics tools. But do you know the meaning of “cohort analysis,” “cross-device,” “content drill down,” or “goal flow”? Make sure that you read the Analytics Help page to get the most from Google Analytics. Visit Analytics Academy to learn not only the terminology but also how to interpret the data.
Tips &Tricks:
One of the best resources for learning more about Google Analytics is its YouTube channel. There are playlists for both beginners and experts, so I highly encourage you to spend some time there to learn more directly from the Google Analytics team.
Focus on Relevant KPI

Google Analytics gives you plenty of room to crunch numbers, interpret graphics, and make deductions. That’s great because it serves bloggers, entrepreneurs, sellers, and marketers! Spending time checking your site’s stats is arguably a necessity. However, there is a fine line between interpreting data and wasting time.
Focus on a limited number of relevant key performance indicators (KPI), or you end up wasting time. Limit yourself to the metrics that are in line with your objectives. For example, gender distribution or browser & OS used don’t have the same relevance as conversion rate or organic traffic if you run a web design blog. An online store manager should focus on effective sales instead of clicks and impressions.
Each site or business is unique, so the set of relevant KPIs will also be unique for each site.
Google Analytics’ Shortcuts

Do you play with various data ranges to study the site’s performance? Are you tired of setting the time intervals? Google Analytics’ shortcuts will save you time. Head to your dashboard and hit the ? button to display the shortcuts. You don’t have many shortcuts, but the one available are genuinely effective.
Tips and Tricks
These aren’t shortcuts, but you will save time by applying these suggestions:
Add your most important properties to the Favorites menu to avoid searching through all your properties for the one you want to check out.

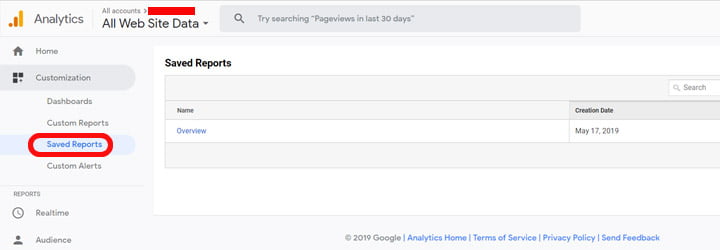
Save your most relevant reports and access them from Saved Reports under the Customization tab.
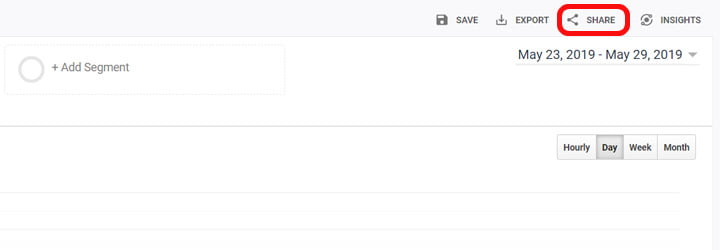
Share reports with your clients or partners just by clicking on the Share button.
Make the Site Faster

There is a plethora of tools to improve a site’s speed, so why should you use Google Analytics? The answer lies in Behavior > Site Speed > Overview. From here, you can extract precious data. Check out Page Timings, Speed Suggestions, and User Timings as well. You can get a full report showing the loading speed of the most visited pages, hints to make them load faster, and a comparison of each webpage to the average loading speed.
Tips and Tricks
- Don’t use these reports alone; try to merge the data with other reports. Benchmark the landing pages against the fastest pages. Are they below or above average?
- Use secondary dimensions for more detailed data. For instance, check the device category as a secondary dimension to identify slowly loading pages on mobile.
Custom Dashboards
I previously mentioned the importance of focusing on relevant KPIs. You can create your own custom dashboard displaying these KPIs. Sign in to your Google Analytics account, head to the Reports sections, click on Customization > Dashboards, and hit the Create button. Now you are free to add the reports you need in your custom dashboard. Consult Analytics Help for more detailed information.
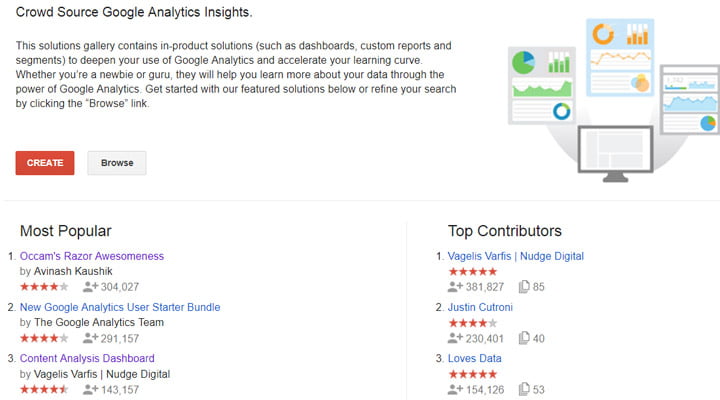
Do you want to learn how other marketers or bloggers use Google Analytics? Visit the Solutions Gallery to import custom dashboards. Here you will find custom dashboards, reports, and segments. Renowned experts have created some of these dashboards, and hundreds of thousands of users have tested and rated them as excellent.
Custom Alerts

Do you want to know every major traffic change or when the site’s bounce rate is lowered by 20%? Google Analytics allows users to set up custom alerts. Go to Google Analytics and select the Admin section. Click on Custom Alerts under the View column. Next, hit the New Alert button and play with all the alert conditions until you set up the desired alert. You will get alerted via email or text message.
Custom Segments
Creating segments in your reports isn’t a task requiring advanced knowledge, but using them efficiently is. For each report, you can use segments to refine the data. Visit the Solutions Gallery once again to import useful segments to eliminate spam referrals, see local traffic, or filter screen resolutions.
Depending on your site’s purpose, custom segments will allow you to better understand user behavior and needs. Google Analytics shows a brute report between new and returning visitors, but you don’t have any idea about how many times a user checked out your site. Create a segment to display users who have visited your site three or five times—you could call them “loyal visitors.” Now you will have a better image of the loyal visitors and can act consequently; chances are that they are easier to convert.
Internal Site Search

What people type in the site search form is pure gold for you! You will get an idea of what your content lacks and some search queries that could be the topic of new pieces of content. Google Analytics shows you what people typed in the search form. Go to Behavior > Site Search > Overview to find not only the search queries but also data such as
- The number of sessions with search
- Search refinements (the percentage of users who performed a second search)
- Time after search (time spent on site after performing the search)
Conclusion
Deciphering all of Google Analytics’ secrets takes time and requires a strong commitment. I hope that all the above tips will help you better leverage the data.
Do you have a special Google Analytics trick or a wowing custom dashboard, report, or segment? Share it with us by leaving a comment. We are waiting for your contribution!
Leave a Reply